5 Reasons to Sell Your Home IN Walterboro, SC.


Sept. 8, 2022

Should I Sell my Home Today?

Should I Sell My Home Today?

There’s no denying the housing market is undergoing a shift this season as buyer demand slows and the number of homes for sale grows. But that shift actually gives you some unique benefits when you sell. Here’s a look at the key opportunities you have if you list your house this fall.

Opportunity #1: You Have More Options for Your Move

One of the biggest stories today is the growing supply of homes for sale. Housing inventory has been increasing since the start of the year, primarily because higher mortgage rates helped cool off the peak frenzy of buyer demand. But what you may not realize is, that actually could benefit you.

If you’re selling your house to make a move, it means you’ll have more options for your own home search. That gives you an even better chance to find a home that checks all of your boxes. So, if you’ve put off selling because you were worried about being able to find somewhere to go, know your options have improved.

Opportunity #2: The Number of Homes on the Market Is Still Low

Just remember, while data shows the number of homes for sale has increased this year, housing supply is still firmly in sellers’ market territory. To be in a balanced market where there are enough homes available to meet the pace of buyer demand, there would need to be a six months’ supply of homes. According to the latest report from the National Association of Realtors (NAR), in July, there was only a 3.3 months’ supply.

While you’ll have more options for your own home search, inventory is still low, and that means your home will still be in demand if you price it right. That’s why the most recent data from NAR also shows the average home sold in July still saw multiple offers and sold in as little as 14 days.

Opportunity #3: Your Equity Has Grown by Record Amounts

The home price appreciation the market saw over the past few years has likely given your equity (and your net worth) a considerable boost. Danielle Hale, Chief Economist at realtor.comexplains:

“Home owners trying to decide if now is the time to list their home for sale are still in a good position in many markets across the country as a decade of rising home prices gives them a substantial equity cushion . . .” 

If you’ve been holding off on selling because you’re worried about how rising prices will impact your next home search, rest assured your equity can help. It may be just what you need to cover a large portion (if not all) of the down payment on your next home.

Bottom Line

If you’re thinking about selling your house this season, work with a real estate professional so you have the expert insights you need to make the best possible move today.

Visit our Sell My Home page Click Here

April 21, 2022

Why This Housing Market is Not a Bubble about to Pop

Why This Housing Market is Not a Bubble about to Pop

Homeownership has become a major element in achieving the American Dream. A recent report from the National Association of Realtors (NAR) finds that over 86% of buyers agree homeownership is still the American Dream.

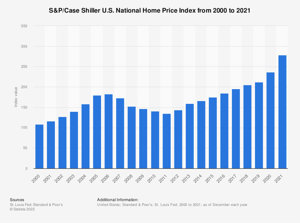
Prior to the 1950s, less than half of the country owned their own home. However, after World War II, many returning veterans used the benefits afforded by the GI Bill to purchase a home. Since then, the percentage of homeowners throughout the country has increased to the current rate of 65.5%. That strong desire for homeownership has kept home values appreciating ever since. The graph below tracks home price appreciation since the end of World War II:

The graph shows the only time home values dropped significantly was during the housing boom and bust of 2006-2008. If you look at how prices spiked prior to 2006, it looks a bit like the current spike in prices over the past two years. That may lead some people to be concerned we’re about to see a similar fall in home values as we did when the bubble burst. To help alleviate those worries, let’s look at what happened last time and what’s happening today.

What Caused the Housing Crash 15 Years Ago?

Back in 2006, foreclosures flooded the market. That drove down home values dramatically. The two main reasons for the flood of foreclosures were:

1. Many purchasers were not truly qualified for the mortgage they obtained, which led to more homes turning into foreclosures.
2. A number of homeowners cashed in the equity on their homes. When prices dropped, they found themselves in an underwater situation (where the home was worth less than the mortgage on the house). Many of these homeowners walked away from their homes, leading to more foreclosures. This lowered neighboring home values even more.

This cycle continued for years.

Why Today’s Real Estate Market Is Different

Here are two reasons today’s market is nothing like the one we experienced 15 years ago.

1. Today, Demand for Homeownership Is Real (Not Artificially Generated)

Running up to 2006, banks were creating artificial demand by lowering lending standards and making it easy for just about anyone to qualify for a home loan or refinance their current home. Today, purchasers and those refinancing a home face much higher standards from mortgage companies.

Data from the Urban Institute shows the amount of risk banks were willing to take on then as compared to now.

There’s always risk when a bank loans money. However, leading up to the housing crash 15 years ago, lending institutions took on much greater risks in both the person and the mortgage product offered. That led to mass defaults, foreclosures, and falling prices.

Today, the demand for homeownership is real. It’s generated by a re-evaluation of the importance of home due to a worldwide pandemic. Additionally, lending standards are much stricter in the current lending environment. Purchasers can afford the mortgage they’re taking on, so there’s little concern about possible defaults.

And if you’re worried about the number of people still in forbearance, you should know there’s no risk of that causing an upheaval in the housing market today. There won’t be a flood of foreclosures.

2. People Are Not Using Their Homes as ATMs Like They Did in the Early 2000s

As mentioned above, when prices were rapidly escalating in the early 2000s, many thought it would never end. They started to borrow against the equity in their homes to finance new cars, boats, and vacations. When prices started to fall, many of these homeowners were underwater, leading some to abandon their homes. This increased the number of foreclosures.

Homeowners didn’t forget the lessons of the crash as prices skyrocketed over the last few years. Black Knight reports that tappable equity (the amount of equity available for homeowners to access before hitting a maximum 80% loan-to-value ratio, or LTV) has more than doubled compared to 2006 ($4.6 trillion to $9.9 trillion).

The latest Homeowner Equity Insights report from CoreLogic reveals that the average homeowner gained $55,300 in home equity over the past year alone. Odeta Kushi, Deputy Chief Economist at First Americanreports:

“Homeowners in Q4 2021 had an average of $307,000 in equity – a historic high.”

ATTOM Data Services also reveals that 41.9% of all mortgaged homes have at least 50% equity. These homeowners will not face an underwater situation even if prices dip slightly. Today, homeowners are much more cautious.

Bottom Line

The major reason for the housing crash 15 years ago was a tsunami of foreclosures. With much stricter mortgage standards and a historic level of homeowner equity, the fear of massive foreclosures impacting today’s market is not realistic.


Cal Griffin has been a Realtor since 2005 and has won numerous awards in the industry. He is a native of Walterboro, SC and is an expert in Homes, Land, River and Beach Property.  He is co-Owner and Broker in Charge of All Country Real Estate.

Source-KCM


April 20, 2022

Where's the Walterboro Market headed?

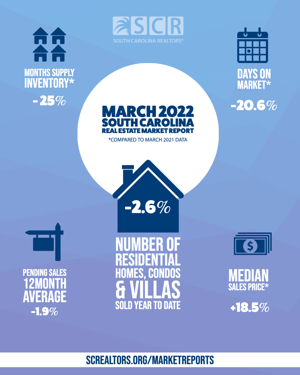
"Where's the Walterboro market Headed?" I hear this question almost everyday. Most times I tell them that I don't have a crystal ball but I know that we are getting ready to slow down a bit.  With the Feds raising the rates, it will keep a lot of the first time home buyers from entering into the market.  However, demand for homes are still very strong. Check out this report from March created by the SC Realtors:

Feb. 4, 2022

Sorry to Burst your Bubble

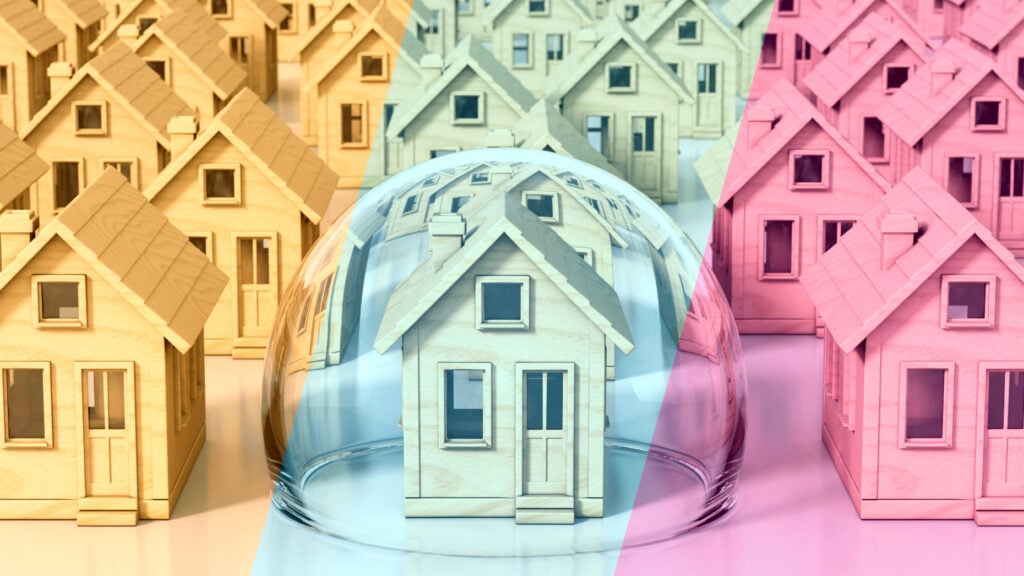
Sorry to burst your bubble, but we’re not in one, housing experts say

Today's rising home prices and a persistent seller’s market differ from the 2007 housing bubble in a few key ways, economists told Inman. In short, don't expect bubbles bursting anytime soon

Sorry to burst your bubble, but we’re not in one, housing experts sayBY TAYLOR ANDERSON

Historically low inventory leading buyers to make rushed decisions. Bidding wars helping push up record high housing prices. Many in the nation’s largest homebuying generation are being priced out of markets nationwide. Are these the signs of a housing bubble?

It’s hard not to look at the unprecedented territory of the U.S. post-COVID housing market with a twinge of fear that the country is returning to conditions that existed before the collapse around the Great Recession.

As common as the question is these days, economists say today’s market boils down to the simple economic principles of supply and demand.

“I was thinking, ‘What is really a bubble?’” said Selma Hepp, chief economist of CoreLogic. “There is no firm definition of a bubble.”

“To some people, high appreciation is going to be a bubble. To others it’s high speculation,” Hepp said. “Generally among economists we think when there is an increase in speculation, when people are buying based on expectation of appreciation as opposed to that need for housing, that’s when we could be in a bubble.”

Yet there are many more signs that point to a healthy market that was sped up due to unique conditions brought on by the coronavirus pandemic. 

In a way, the pandemic may have led buyers who ordinarily might have purchased a first or second home in a few years to do so much sooner.

“One question we don’t know for sure is how many people moved forward to buy a house because of the stimulus and low interest rates that they would have bought this year or next year,” said Doug Duncan, chief economist at Fannie Mae.

That expedited purchasing might not make it any easier for those who are getting squeezed out of entering the market for the first time.

Josh Alberto | Porchlight San Diego


“Everybody is going to have their own mindset and excuses to do or not to” buy, said Kyle Alberto, an agent with Porchlight in San Diego. “I just explain [that] buying now versus holding off and waiting for a bubble to burst is likely going to put you in a place where you’re paying the same price or more but at a much larger interest rate.”

Stronger buyers, safer loans

There are a few things that make the market’s ongoing ramp up fundamentally different this time around.

More recently, the market has been driven by much healthier, fixed-rate and 30-year mortgages that give owners certainty after buying.

“We have much stronger borrowers [and] less risky loan products,” said Nicole Bachaud, a Zillow economist. “The vast majority of buyers are getting 30-year fixed mortgages … If you lock in a 30-year mortgage your monthly payment is not going to be changing.”

While that rate is rising and expected to keep climbing, it pales in comparison to the rates from 30 and 40 years ago.

Nicole Bachaud | Zillow Economist


Lenders are also taking fewer risks when it comes to qualifying buyers. Foreclosures in 2021 dropped to the lowest rate since tracking began in 2005, according to ATTOM Data Solutions.

“In 2006 to 2008, really what drove price appreciation being so high and home evaluation being so inflated was the idea of excess,” Bachaud said. “People were given a lot more credit than they [should have been]. They had a lot of risky loan types.”

The pandemic shifted people all over the country, leading to demographic changes at warp speed.

Buyers bidding on homes and driving up the cost of housing shows the fundamental supply-demand economy at work. 

‘Organic’ supply and demand principles

The lead-up to the 2007 housing collapse saw speculation, over-extended credit and other factors that artificially inflated prices.

“What we’re having now is the complete opposite. We have a market that’s run on scarcity,” Zillow’s Bachaud said. “That’s an organic and sustainable thing that’s happening. In that sense these are completely different markets.”


Alberto’s clients in San Diego are more concerned about simply finding a house to make an offer on.

Same goes for Dirk Hmura, with ELEETE Real Estate in Portland, Oregon, who said he isn’t hearing so much concern about a bubble as much as the impact of rising interest rates.

Dirk Hmura | ELEETE Real Estate

“In Portland, we have such a lack of inventory — zero homes for sale,” Hmura said. “There’s so much demand out there still … we’re getting eight to 12 offers on every house.”

And with millennials taking over as the country’s largest group of homebuyers, there’s no indication that will slow soon.

“We’re still three to four years away from the peak first-time homebuyer age in the millennial generation,” Duncan said. “Secondly, when you look at the underwriting criteria, the risks being taken in the lending space are nothing like they were back in the 2005 to 2007 timeframe.”


“Those two things together suggest it’s more of a mismatch of supply and demand,” he added.


July 30, 2021

Is the Market Cooling?

June Market Report: Inventory Increases For The First Time In 15 Months

Inventory Of Homes For Sale Increases For The First Time In 15 Months
Sales and Prices Continue to Increase in a Competitive Market

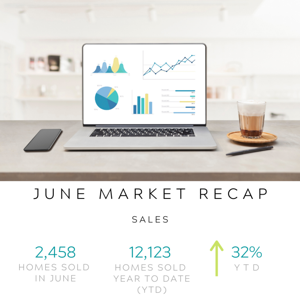
CHARLESTON, SC—(July 12, 2021) 2,458 homes sold in June in the Charleston region at a median price of $353,544 according to preliminary data released today by the Charleston Trident Association of Realtors® (CTAR).

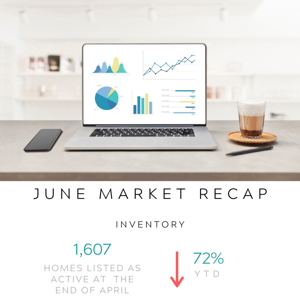
Inventory data shows 72% fewer homes for sale over the last 12-month period, with 1,607 homes listed as “active” for sale in the CHS Regional MLS database at the end of June—representing the first increase in available inventory since April 2020.

May Adjustment
Preliminary data showed 2,173 homes sold in May in the Charleston region at a median price of $349,000. Updated data now shows 2,185 sales at a median price of $348,795.

Berkeley County
690 homes sold at a median price of $287,500 in Berkeley County in June, 609 single-family homes and 81 condos/townhomes.

Year-to-date, 3,037 single-family homes have sold at a median price of $325,000. Today’s report shows a 41% increase in sales and a 17% increase in median sale price. 394 condos/townhomes have sold at a median price of $216,995 so far this year—a 21% increase in sales and 14% increase in price.

There are currently 308 residential properties for sale in Berkeley County; 279 single-family homes and 29 condos/townhomes.

Charleston County
1,189 homes sold at a median price of $399,200 in Charleston County in June, 873 single-family homes and 316 condos/townhomes.

Year-to-date, 4,252 single-family homes have sold at a median price of $492,000. Today’s report shows a 26% increase in sales and 25% increase in median sale price. 1,592 condos/townhomes have sold at a median price of $280,000 so far this year—a 45% increase in sales and 12% increase in pricing.

There are currently 836 residential properties for sale in Charleston County; 586 single-family homes and 250 condos/townhomes.

Colleton County
33 homes sold at a median price of $236,900 in Colleton County in June, 30 single-family homes and 3 condos/townhomes.

Year-to-date, 178 single-family homes have sold at a median price of $295,000. Today’s report shows a 13% increase in sales and 56% increase in median sale price. 27 condos/townhomes have sold at a median price of $228,000 so far this year—a 17% increase in sales and 10% decline in pricing.

There are currently 48 residential properties for sale in Colleton County; 48 single-family homes and no condos/townhomes.

Dorchester County
446 homes sold at a median price of $271,988 in Dorchester County in June, 368 single-family homes and 78 condos/townhomes.

Year-to-date, 1,858 single-family homes have sold at a median price of $303,000. Today’s report shows a 21% increase in sales and 14% increase in median sale price. 305 condos/townhomes have sold at a median price of $217,900 so far this year—a 46% increase in sales and 15% increase in pricing.

There are currently 214 residential properties for sale in Dorchester County; 178 single-family homes and 36 condos/townhomes.

written by CTAR staff 07/2021

June 23, 2021

US existing-home prices hit another record high in May: NAR

US existing-home prices hit another record high in May: NAR

Median existing-home prices soared 23.6% year over year to a record high of $350,300, as monthly price gains continue

Median existing-home price across all housing types hit a record high of $350,300 in May, up 23.6 percent from the year before, according to a new report released Tuesday morning by the National Association of Realtors (NAR). Home prices rose across all U.S. regions as the new high marked 111 consecutive months of annual price gains since March 2012.

Existing-home sales dropped slightly for the fourth consecutive month in May, with sales down 0.9 percent from the previous month to a seasonally adjusted annual rate of 5.8 million. However, existing-home sales were still up 44.6 percent year over year from 4.01 million in May 2020.

“Home sales fell moderately in May and are now approaching pre-pandemic activity,” NAR Chief Economist Lawrence Yun said in a press statement. “Lack of inventory continues to be the overwhelming factor holding back home sales, but falling affordability is simply squeezing some first-time buyers out of the market.”

Yun, however, expressed optimism at the market’s overall trajectory, despite the lack of inventory continuing to impede homebuyers.

“The market’s outlook, however, is encouraging,” Yun added. “Supply is expected to improve, which will give buyers more options and help tamp down record-high asking prices for existing homes.”

By the end of May, total inventory reached 1.23 million units, an increase of 7 percent from April, but down 20.6 percent year over year. That amount of inventory represents a 2.5-month supply, up from 2.4 months supply the previous month, but down from 4.6 months from the previous year.

Properties spent about 17 days on the market in May, which reflected no change from April, but is down from 26 days in May 2020. Nearly 90 percent of properties sold in May spent less than one month on the market.

First-time homebuyers made up 31 percent of May sales, the same proportion as in April. Investors, or second-home buyers, made up 17 percent of home sales, also equal with the number of investor-buyers in April.

Distressed sales (foreclosures and short sales) made up less than 1 percent of sales in May, equal to the rate in April.

Single-family home sales declined 1 percent from April to a seasonally adjusted annual rate of 5.08 million in May. However, that rate was still up 39.2 percent from the previous year. Meanwhile, the median existing single-family home price was up 24.4 percent year over year to $356,600.

Existing condo and co-op sales remained consistent with April’s numbers at a seasonally adjusted annual rate of 720,000 units. That figure, however, is up 100 percent from the previous year. The median existing condo price also increased year over year, by 21.5 percent to $306,000.

NAR President Charlie Oppler expressed NAR’s commitment to furthering housing policies to address the national shortage of inventory.

“NAR continues its advocacy efforts to find new, creative and effective ways to increase housing construction and supply,” Oppler said in NAR’s report. “The right policies will provide huge benefits to our nation’s economy, and our work to close this gap will be particularly impactful for lower-income households, households of color and first-time buyers.”

The Midwest was the only region that saw increased sales from the month before, with sales rising 1.6 percent to an annual rate of 1,310,000, up 27.2 percent from the previous year. The median price of existing-home sales in the region was $268,500, up 18.1 percent from the year before.

In the Northeast, existing-home sales dropped 1.4 percent to an annual rate of 720,000, which is still up 46.9 percent from May 2020. The median price was $384,300, up 17.1 percent year over year.

Existing-home sales in the South decreased 0.4 percent to an annual rate of 2,590,000, which is up 47.2 percent from the year before. The median price was $299,400, up 22.6 percent from May 2020.

Existing-home sales dropped most precipitously in the West, by 4.1 percent from the previous month to an annual rate of 1,180,000. However, that number is still 61.6 percent up from the year before. The median price was $505,600, up 24.3 percent from May 2020.


May 30, 2021

5 Facts About Memorial Day You Did Not Know


5 Facts About Memorial Day You Did Not Know


1. Memorial Day was originally known as Decoration Day

It is not clear where the traditions of Memorial Day began, but not long after the Civil War ended, several cities began holding tributes in the spring for the soldiers who fell during the war. People would honor the fallen by decorating their graves and praying.

General John A. Logan called for a nationally recognized day of remembrance to honor the soldiers who gave their lives for their country on May 5, 1862. He proclaimed May 30, 1868 to be the first Decoration Day:

“The 30th of May, 1868, is designated for the purpose of strewing with flowers, or otherwise decorating the graves of comrades who died in defense of their country during the late rebellion, and whose bodies now lie in almost every city, village and hamlet churchyard in the land,”

Logan chose May 30 because it was not the anniversary of any particular battle. By 1890, every state in the North had adopted Decoration Day as an official state holiday.

Many Southern states did not share a day to remember and honor their dead until after World War I when the purpose of Decoration Day was expanded to honor fallen U.S. troops from all wars. Though the name Memorial Day was first used in the early 1880s, the name didn’t catch on until after World War II.

2. The Birthplace of Memorial Day


As mentioned above, there is no evidence to pinpoint the exact place of origin for Memorial Day. Several towns claim to be the originator of the holiday, but it is near impossible to validate any of these claims.

3. The Uniform Monday Holiday Act

In 1968, Congress passed a bill called the “Uniform Monday Holiday Act.” For many decades, Memorial Day was celebrated on May 30. However, under this law, Memorial Day was not only declared an official federal holiday, it was changed to fall on the last Monday of May so federal workers could have a three-day weekend. The change went into effect in 1971.

4. The National Moment of Remembrance

In December 2000, Congress passed a law that “requires” Americans to pause at 3 PM on Memorial Day and take a moment of silence to honor the fallen. The time was designated as the National Moment of Remembrance and serves as an act of national unity in remembering all of the men and women who have given their lives in service of the United States.

The time 3 PM was chosen because that is when most Americans are enjoying their freedoms during the holiday.

A Gallup poll released on March 26, 2000 revealed that, for the most part, a solid majority of Americans got the general concept of what Memorial Day was about, but only 28 percent knew, with confidence, the exact meaning of the holiday. What likely caught lawmakers' attention, however, was how Americans spend their time on Memorial Day.

The traditional celebration of Memorial Day includes going to veteran cemeteries and attending the local Memorial Day parade. However, that's now how most Americans celebrate the holiday, according to surveys. In fact, most people just spend the day at home.

As his presidency came to an end, President Clinton signed into the law the National Moment of Remembrance so that all Americans were encouraged to take a moment to remember what Memorial Day is truly about.

For those who enjoy watching baseball on Memorial Day, every MLB game halts in recognition of the National Moment of Remembrance. Other participants include Amtrak, NASCAR, NASA, the Statue of Liberty, the Liberty Bell, and hundreds more.


5. Memorial Day is considered the unofficial first day of summer

Light up the barbecues and take a moment to enjoy the beautiful weather because summer has begun! Well, unofficially it has. Many people like to celebrate Memorial Day weekend as the first long weekend of the summer season by grilling out, going camping, taking a trip to the local lake or pool, and even launching some fireworks.

Technically, the first day of summer is marked by the June Solstice, which falls on June 20 or 21 every year. It is the longest day of the year. However, a three-day weekend at the end of May presents the perfect opportunity to welcome the season.


May 16, 2021

How long will the housing shortage last? Years — here's why

BY BEN CABALLERO

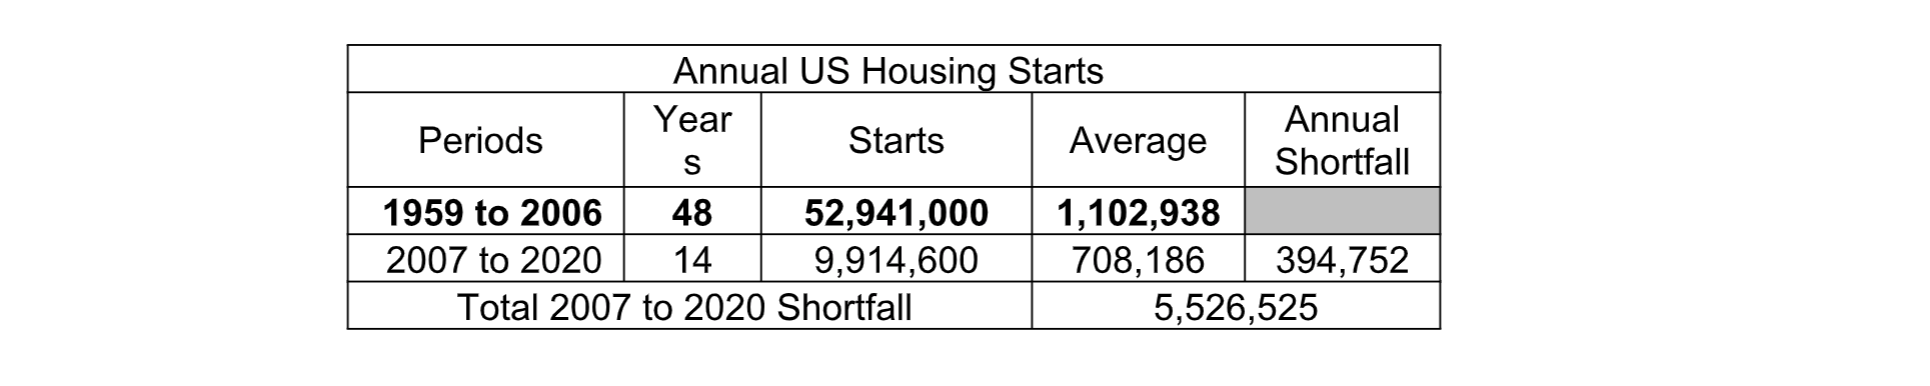
Beginning in 1959, the US Census Bureau started to record housing starts. During the 48 years between 1959 and 2006, builders completed 52,941,000 homes for an average of 1,102,938 homes per year.

For the 14 years between 2007 to 2020, builders started 9,914,600 homes or 708,186 homes per year, which is 394,752 fewer starts per year than the historical average. This annual shortfall totals 5,526,525 homes during those years. In 2020, builders started 990,500 homes, still below the historical average of 1.1 million annual starts.


Homebuyers are now paying the price for the need for homes continued, intensified by a combination of new developments that increased housing demand. Included are the COVID-19 lockdowns that forced many to work, teach and learn remotely, a population that continued to live longer, preventing their homes from being recycled.

Millennials began reaching the homebuying age. Institutional investors entered the market in force. Local, state and federal restrictions and mandates increased, and interest rates decreased to record levels bringing in more buyers.

The population shift to states like Florida, Texas, Arizona and other states added to housing demand. And as if that were not enough, the immigration crisis at our border will further exacerbate our national housing demand.

The homebuilding industry was devastated and still suffers from the disintermediation of labor and manufacturing that began in 2006 and continued until 2012. Production then made a weak advance after housing starts dipped as low as 430,600 in 2011. That’s a drop of 75 percent or 1,288,200 starts, below the 2005 starts of 1,715,800 homes, according to the U.S. Census data

Everyone is asking, “Are we in a Bubble?” Whatever we call it, the question on everyone’s mind is: How long will the shortage last? The table above shows that between 2007 and 2020, America had a shortfall of 5,526,525 housing starts. 

The question “How long will the shortage last?” can be answered with simple math. Statistics show we have a 5,526,525 housing starts shortfall. Assuming the historical annual home starts of 1.1 million homes per year as adequate — and that builders could build 1.5 million homes a year — the national home inventory would gain 400,000 starts per year to apply to the shortfall. 

Here is the math: 5,526,525 by 400,000 equals 13.8 years. That’s not good news for homebuyers.

Thinking optimistically and knowing a little about U.S. homebuilders and American ingenuity, builders might create an average of 2 million homes annually and achieve a supply-demand balance in about six years.

What has caused the demand-supply imbalance?

Except for the 1973 OPEC Oil Embargo, market downturns since 1959 were caused by changes in federal legislation or policies that affected interest rates or tax policy. Federal action is not driving the market today, but its policies are responsible for damaging builder production.

For those who do not know or remember, in the early 2000s, the federal government wanted as many people as possible to own a home. To make that happen, lenders encouraged (if not coerced) to abandon established lending practices, making risky subprime loans.


Home loans were originated without regard to credit, employment or down payment. Circumvention of established lending guidelines was facilitated by the unprecedented policies of FHA, FNMA and FMAC that allowed sellers to gift down payments and closing costs to buyers through third parties.

May 16, 2021

How Has the Spike in Lumber Prices Increased Home Costs?

written by Matt Myre

Last March, lumber mills across the United States and the world shut down in response to the COVID-19 pandemic. Today, the economy is climbing back—but the aftershocks of last spring are rolling in harder than ever.

As of late April, lumber prices were up 67% from the beginning of the year and a massive 340% higher than one year ago, according to Random Lengths, a tracking firm for wood products.

With homebuyer demand maxed out, real estate markets across the nation are in desperate need of new construction. But if lumber remains as expensive as it is, there’s a real barrier to building homes.

Lumber adds almost $36,000 to home costs

This time, last year, the average cost of lumber totaled around $350 per thousand board feet. Today, that number stands at about $1,200 per thousand board feet.

The inflated price has pushed home values even higher. The National Association of Home Builders (NAHB) estimates that the past 12 months of lumber costs have added an additional $35,872 to the price tag of an average new single-family home.

This comes amid a market gasping for more listings. New homes account for a quarter of active listings, which is the highest market share on record. But that’s not because enough new homes are being constructed. Instead, it’s due to a significantly low inventory of existing homes. For context, usually, new constructions take up around one-tenth of the total inventory.

With demand so high, home prices were naturally going to rise. Tack on high lumber costs and prices skyrocket. This is an issue, of course, since higher prices are locking out a lot of would-be buyers such as millennials and families with lower incomes.

It doesn’t stop at the sales market either. Multifamily homes, for instance, have increased in price by $13,000 on average. This has added an extra $119 to monthly rent, amplifying affordability concerns.

The strain on builders

Sticker prices are up at every level of real estate, but builders are footing the bill the earliest. Builders across the nation have lost access to wholesale lumber because the supply simply isn’t there.

Mills that shut down last year are behind. In fact, lumber is in such hot demand that there have been reports of theft on construction sites.

“Theft has been huge in our market. We have tens if not hundreds of thousands of dollars stolen during the year,” said Brant Chesson, the president and CEO of Homes By Dickerson in Raleigh, North Carolina.

On the other side of North Carolina, in Asheville, Matt Stephen, owner of Alpha Plus Services, a home building and renovation company, weighs in on the difficulty of the market’s prices. “It’s not just lumber. All materials are going up. Drywall, PVC, electrical wires, all of it,” he said. “I’ve lost more bids this year than any other because I’ve had to pass the cost of materials on to customers. It’s getting tough.”

For construction crews across America, that’s the reality. Rising costs make it more difficult to get desperately needed business. Many renovation projects are either downsized or halted altogether once homeowners take a look at their proposals.

The price of drywall is up nearly 7% from last year. Copper prices set a record high this April and steel was up 18% in March.

Builders are finding that the total cost to construct a new home is now double than it was a year ago.

What’s the fix?

Many are pointing fingers at politics, calling on the Biden Administration to take action. Labor shortages have been more pronounced as the economy recovers quickly, leaving many industries behind in their supply chains.

On the real estate side of things, the shortage of lumber has roots dating back to tariffs that were enacted in 2017. Lumber tariffs were slapped on Canada at a rate of 24% back then. As of late last year, they were reduced to 9%, but some have called for an outright abolishment of the tariff or a temporary suspension.

NAHB Chairman Chuck Fowke is in favor of suspending the tariff in an effort to ease price volatility.

“These lumber price hikes are clearly unsustainable,” said Fowke. “Policymakers need to examine the lumber supply chain, identify the causes for high prices and supply constraints, and seek immediate remedies that will increase production.”

While there’s been no official response from the White House in regard to the lumber situation, there are signs that prices could come back to Earth in the near future.

Jeffrey Mezger, CEO of KB Home, believes we’re through the thick of it. “The mills are coming back online. I think we’re past the worst of it in terms of supply availability.”

Others in the industry believe there could be a sharp drop off in lumber prices within the next 18 months.

While it’s promising to know that there’s an end to the mayhem, 18 months is a long time. Investors should monitor developments between now and then—and pay attention to the specifics of any government response.

March 10, 2021

JUST SOLD!